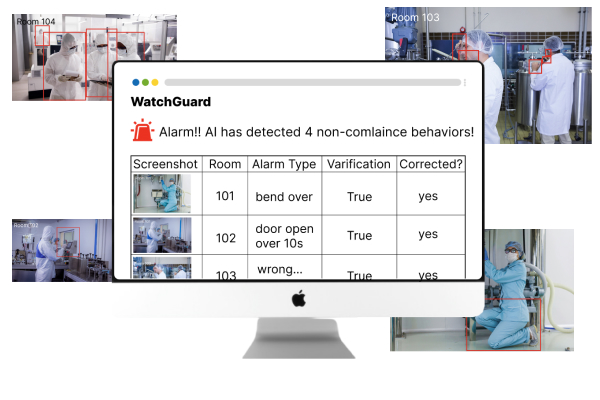
- WatchGuard
- Reportauto
Role: Product Manager Responsibility: Product Strategy, Data Analyze, Product Design Client: Drug Production Plants from a pharmacy CRDMO company Was on Project: March 2023 - September 2024 Special Note: Due to a Non-Disclosure Agreement, "WatchGuard" is a placeholder name. The names of people and product images on this site have been specially recreated solely for the purpose of showcasing my work.They do not represent the actual project.
Project Overview
The WatchGuard project focuses on enhancing product quality by reducing non-compliant behaviors in drug production rooms. Originally conceived in 2018/2019, the project faced several challenges during its early stages, resulting in multiple failed attempts to bring it to fruition. Over time, this led to a loss of confidence among its primary users—six drug production plants—due to prolonged delays and unmet expectations.
I was brought on board in 2023 to revitalize this project and ensure its success.
The Problem
Challenges Facing the Long-Delayed Project That Has Yet to Meet Expectations:
- Loss of User Confidence: Users have lost faith in the project due to past failures and unmet expectations.
- Low Model Accuracy: The AI model's accuracy is suboptimal. The AI engineers focus heavily on improving the model itself rather than addressing the quality of the dataset it relies on.
- Lack of Interpretability: The AI model's results are difficult for humans to review, making it challenging to determine whether its detections are accurate.
- No Feedback Loop: There is no mechanism for users to provide feedback on the model's performance to facilitate continuous improvement.
- Overlapping Stakeholders: The involvement of too many stakeholders complicates decision-making and progress.
- Poor Communication: Users lack a clear understanding of how the model works, how to collaborate to improve it, and the extent of its contributions to the overall goal.
The Goal
My goal was to develop a solution that effectively detects and addresses non-compliant behaviors in production rooms, ensuring these issues are corrected to enhance the overall product quality rate. Equally important was rebuilding user trust by delivering a reliable, transparent, and impactful system that meets their expectations and fosters collaboration.
Understanding the user
In the early stages of the WatchGuard project, the focus was solely on workers in the drug production room, with the singular goal of preventing non-compliance behaviors. However, the absence of a comprehensive user study raised critical questions:
- Are the workers in the drug production room our true and only target users?
- What underlying factors cause non-compliance behaviors to persist?
Through thorough collaborative communications with stakeholders, I uncovered previously unexamined dimensions of the problem. The users of WatchGuard turned out can be categorized into two key personas and four different scenarios:
- Production Room Workers These users are directly involved in operations within the production rooms. WatchGuard monitors their activities in real-time through installed cameras, identifying any non-compliant behaviors and issuing alerts as necessary.
- Production Room Supervisors Supervisors are accountable for the overall quality of products coming from the production rooms. They are responsible for addressing non-compliant behaviors when they occur. As the individuals most invested in maintaining compliance, supervisors are the last people who want to see non-compliant behaviors happening in their rooms.
Persona and Problem Statements

Barry, the Bottle Cleaning Operator, who is responsible for washing and drying bottles. His responsibilities focus on ensuring the cleanliness and sterility of bottles used in the production process. Problem Statement:
Barry made a non-compliance behavior mistake by entering a room that had already reached the maximum allowable number of people according to compliance regulations. He entered the room to help Charlie lift a heavy box full of bottles while other co-workers were focused on their own tasks. In the moment, Larry forgot the overcrowding rule, as it had been a while since he last received training or a reminder about the importance of adhering to such protocols.

Tracy, the Filling Operator, is responsible for operating and monitoring filling equipment to ensure the production process runs smoothly. Problem Statement:
Having just started her job a month ago, Tracy is still getting accustomed to the pace and precision required on the production line. Despite completing full compliance behavior training, she occasionally makes mistakes, such as bending over and touching the lower air, which contains dust and bacteria and could potentially contaminate the drugs.

Zach, the Lyophilization Operator, is responsible for operating and maintaining the freeze-drying equipment. Problem Statement:
While he is aware that compliance rules state that doors should not be left open for more than 10 seconds, he often disregards this regulation. Zach tends to leave doors open when he’s stepping out to quickly grab something he needs, reasoning that it's more convenient and that he’ll be back in a moment.

Talia, the Quality Control Technician. She monitors and inspects the production process to ensure adherence to quality standards and regulatory requirements. Problem Statement:
She is particularly concerned about operators like Tracy, Barry, and Zach, whose mistakes have led to a decline in production quality.
Talia initially hoped that the WatchGuard system would help improve compliance monitoring, but her trust in the product has gradually diminished.
The system has been unreliable, going offline multiple times, and generating numerous false AI alerts. Additionally, the human verification process has proven to be highly inconvenient. She needs to manually review and mark each AI-generated screenshot, but when she returns to the table page to mark whether an alert is a true non-compliance behavior or a false AI alert, she often struggles to locate the relevant images among the long list of results. This inefficiency and frustration have led Talia to lose faith in the system’s effectiveness.
Revitalize WatchGuard Strategies
Building on these critical insights into user personas and the underlying causes of non-compliance behaviors, it became clear that WatchGuard needed a transformative strategy to regain user trust and deliver tangible value.
This realization led to the development of the Revitalize WatchGuard Strategies, aimed at addressing the identified gaps, enhancing user engagement, and creating a scalable model for success. By aligning the system's functionality with the true needs of its users and streamlining its implementation, the strategy provides a clear pathway to restoring confidence in the project and achieving sustainable compliance improvements across all drug production plants.
Here’s how the strategies unfolded.
Realigning Goals and Uncovering Hidden Patterns to Drive Impact
The WatchGuard project was initially designed to address non-compliance behaviors with the goal of improving drug quality, and the focus was placed on the accuracy of the AI model. However, upon further analysis, I recognized that this approach was deviating from the true objective—preventing non-compliance behaviors. I realized that the key measure should not be solely the accuracy of detection, but rather how many non-compliance behaviors are actually caught and prevented.
I shifted the focus from asking "How much is right?" to "How much is caught and avoided?". The true goal should be to identify and prevent non-compliance behaviors, rather than simply improving AI accuracy. This shift in perspective helped align the project with its intended purpose of enhancing compliance and ultimately improving drug quality.
Through user research, I uncovered previously unidentified user behavior patterns. Staff like Barry and Zach, although trained, occasionally forget or fail to adhere to compliance policies. Human nature—forgetfulness and carelessness—plays a significant role in this. To address this, I introduced a "Alert, Vigilant, Slack off, Re-alert" user behavior model (Picture 1) to ensure compliance is consistently reinforced.
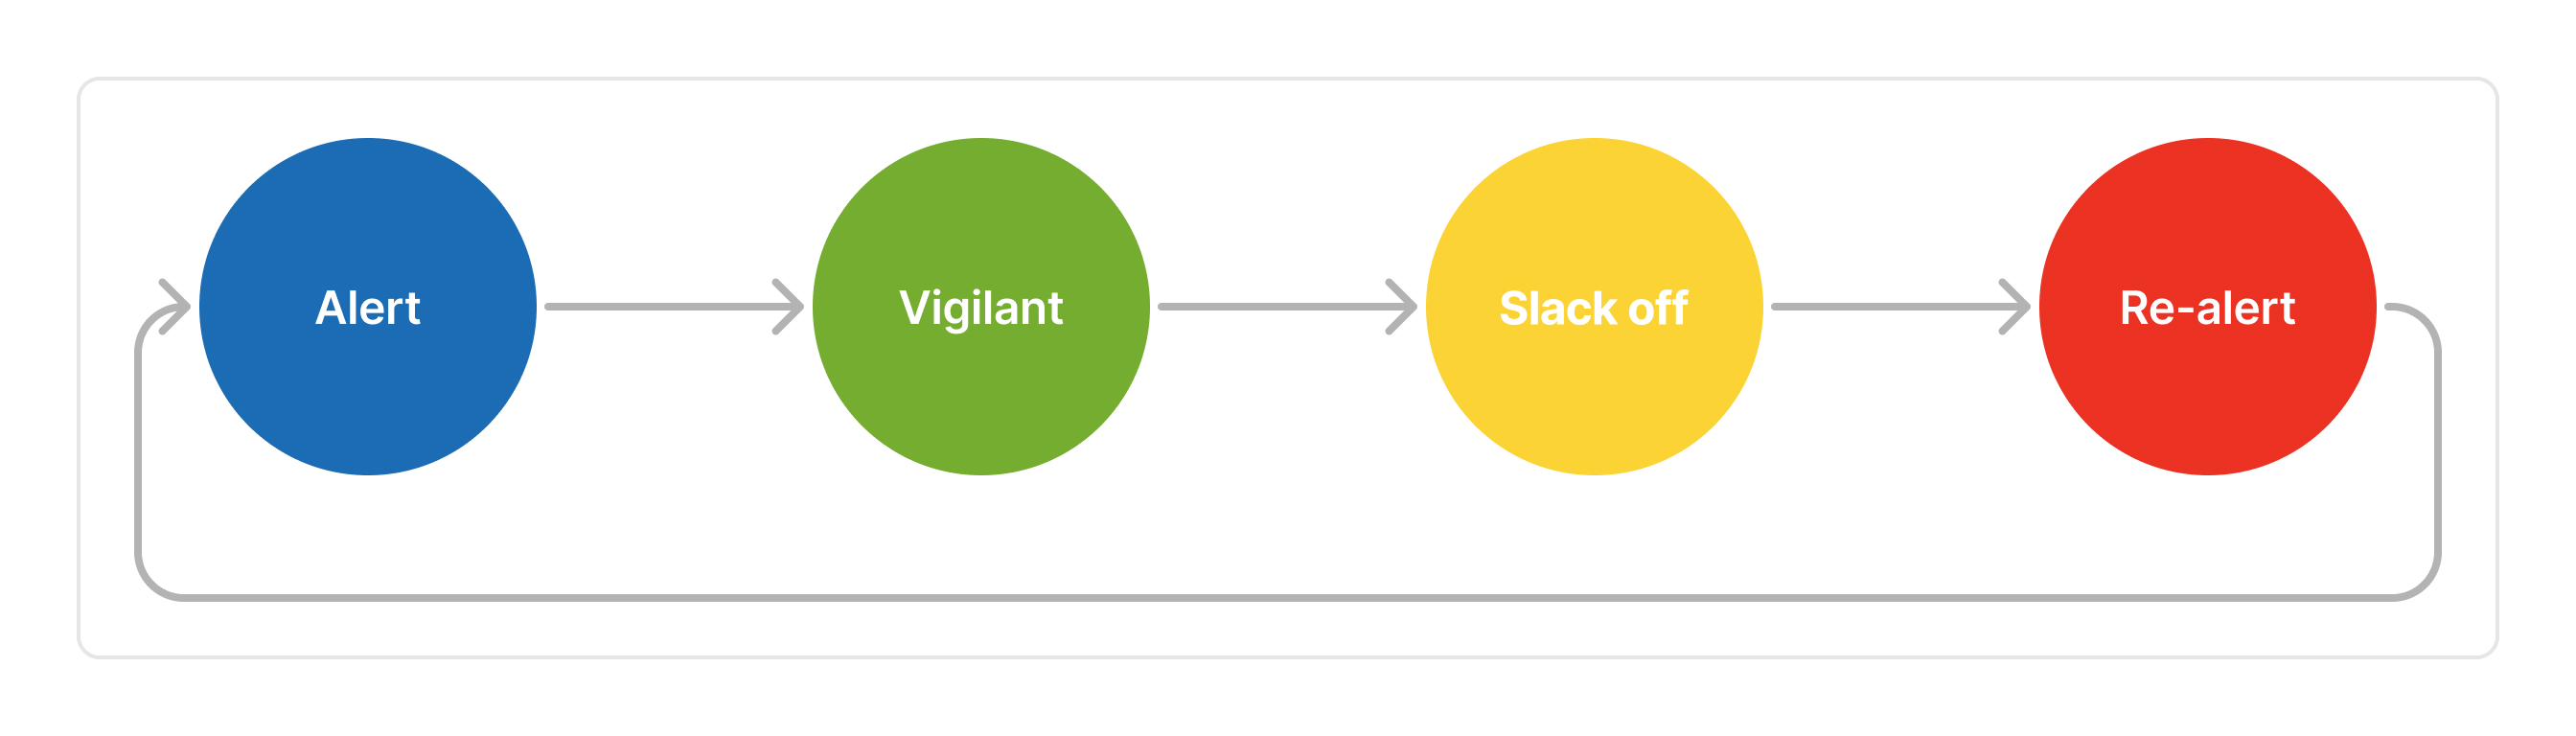
Picture 1: The Alert, Vigilant, Slack off, Re-alert User Behavior Mode
Introducing the Lighthouse User Targeting Strategy
As faith in the project has significantly diminished across the six drug production plants, I adopted a lighthouse strategy—"start small, expand broadly" —(Picture 2)to turn the situation around. Recognizing the users' urgent need for positive outcomes, I consulted with stakeholders and selected Drug Production Plant A, which has maintained the most positive attitude toward the project, as the starting point for its revitalization.
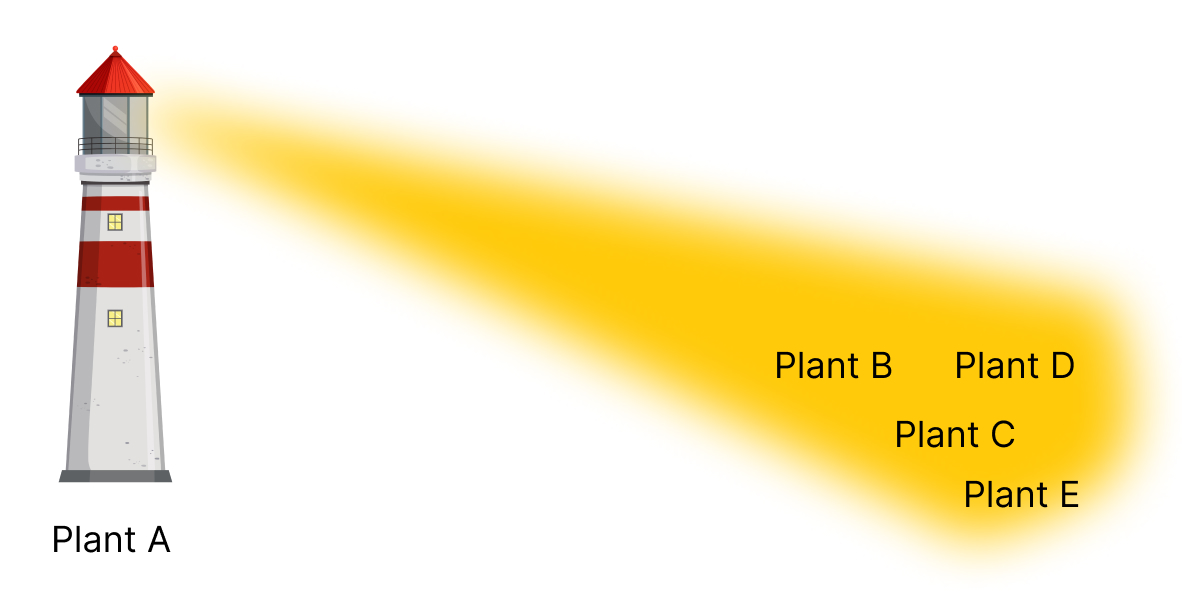
Picture 2: The lighthouse strategy will scale WatchGuard from plant A to plant B,C,D,E
One challenge we faced was the involvement of too many overlapping stakeholders, which complicated decision-making and progress. By narrowing our focus to Plant A, we streamlined stakeholder involvement and concentrated efforts on achieving tangible improvements. These successes will then be scaled to the other production plants.
Simultaneously, I am ensuring that users from the remaining five plants remain engaged and do not perceive the project as abandoned. This is achieved by consistently sharing updates, actions, and successful cases from our progress at Plant A, keeping the broader user base informed and optimistic.
Redesign The User Flow
The WatchGuard project aims to assist Talia, the Quality Control Technician, in using the model to alert workers who are not complying with regulations. However, the project is facing two main issues. First, the AI model’s results are difficult for humans to review, making it challenging to assess the accuracy of its detections due to a lack of interpretability. Second, there is no mechanism in place for users to provide feedback on the model's performance, hindering its continuous improvement.
To address these challenges, I redesigned the user flow. The human verification process has been streamlined, reducing the previous 7 steps to 4, saved 5.5 hours per 1,000 AI outputs(Picture 3). I also added a feedback mechanism to facilitate ongoing AI model improvement(Picture 5).
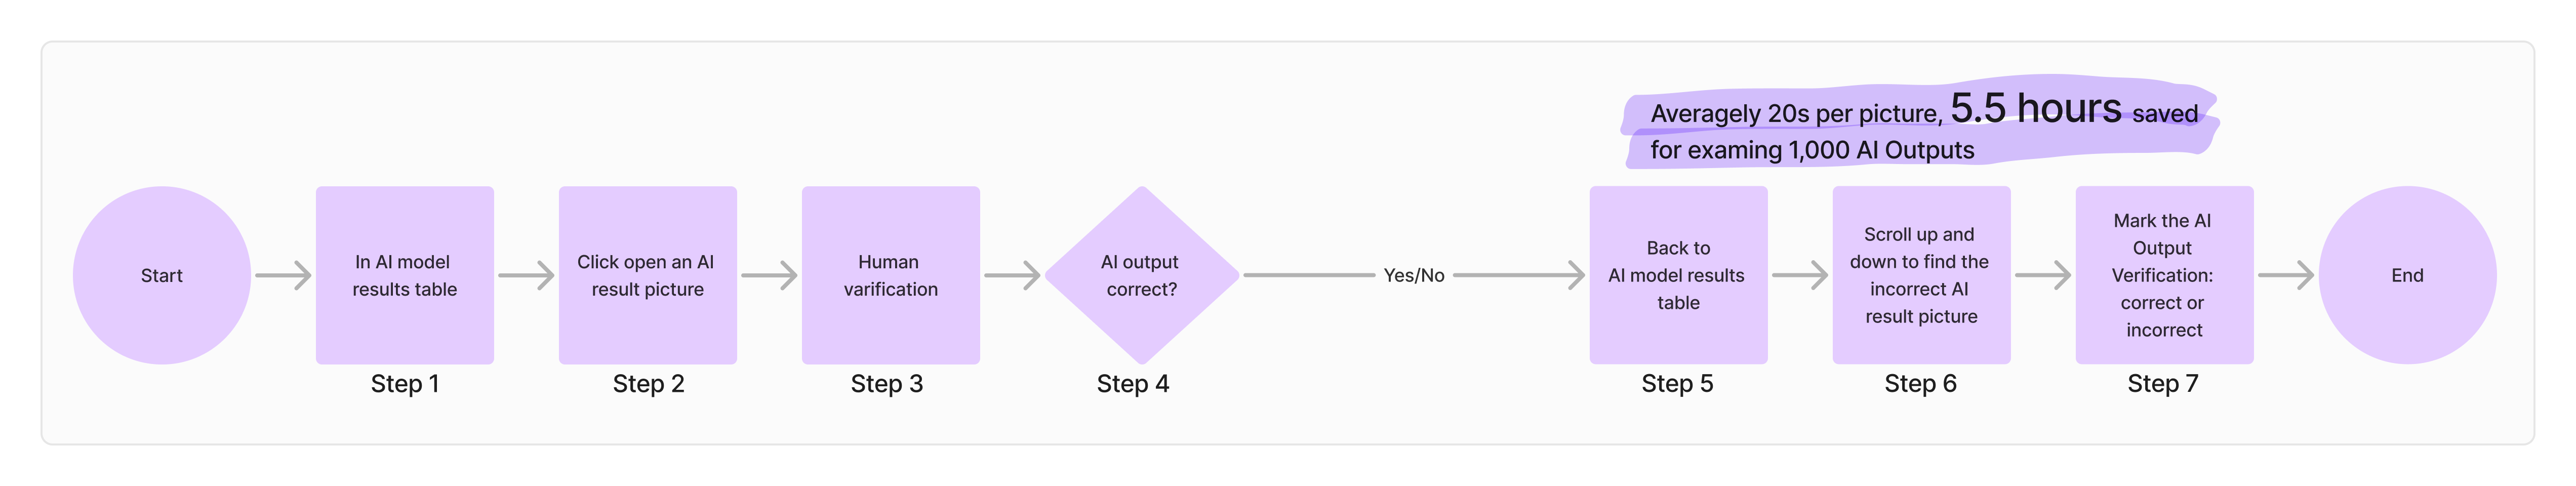
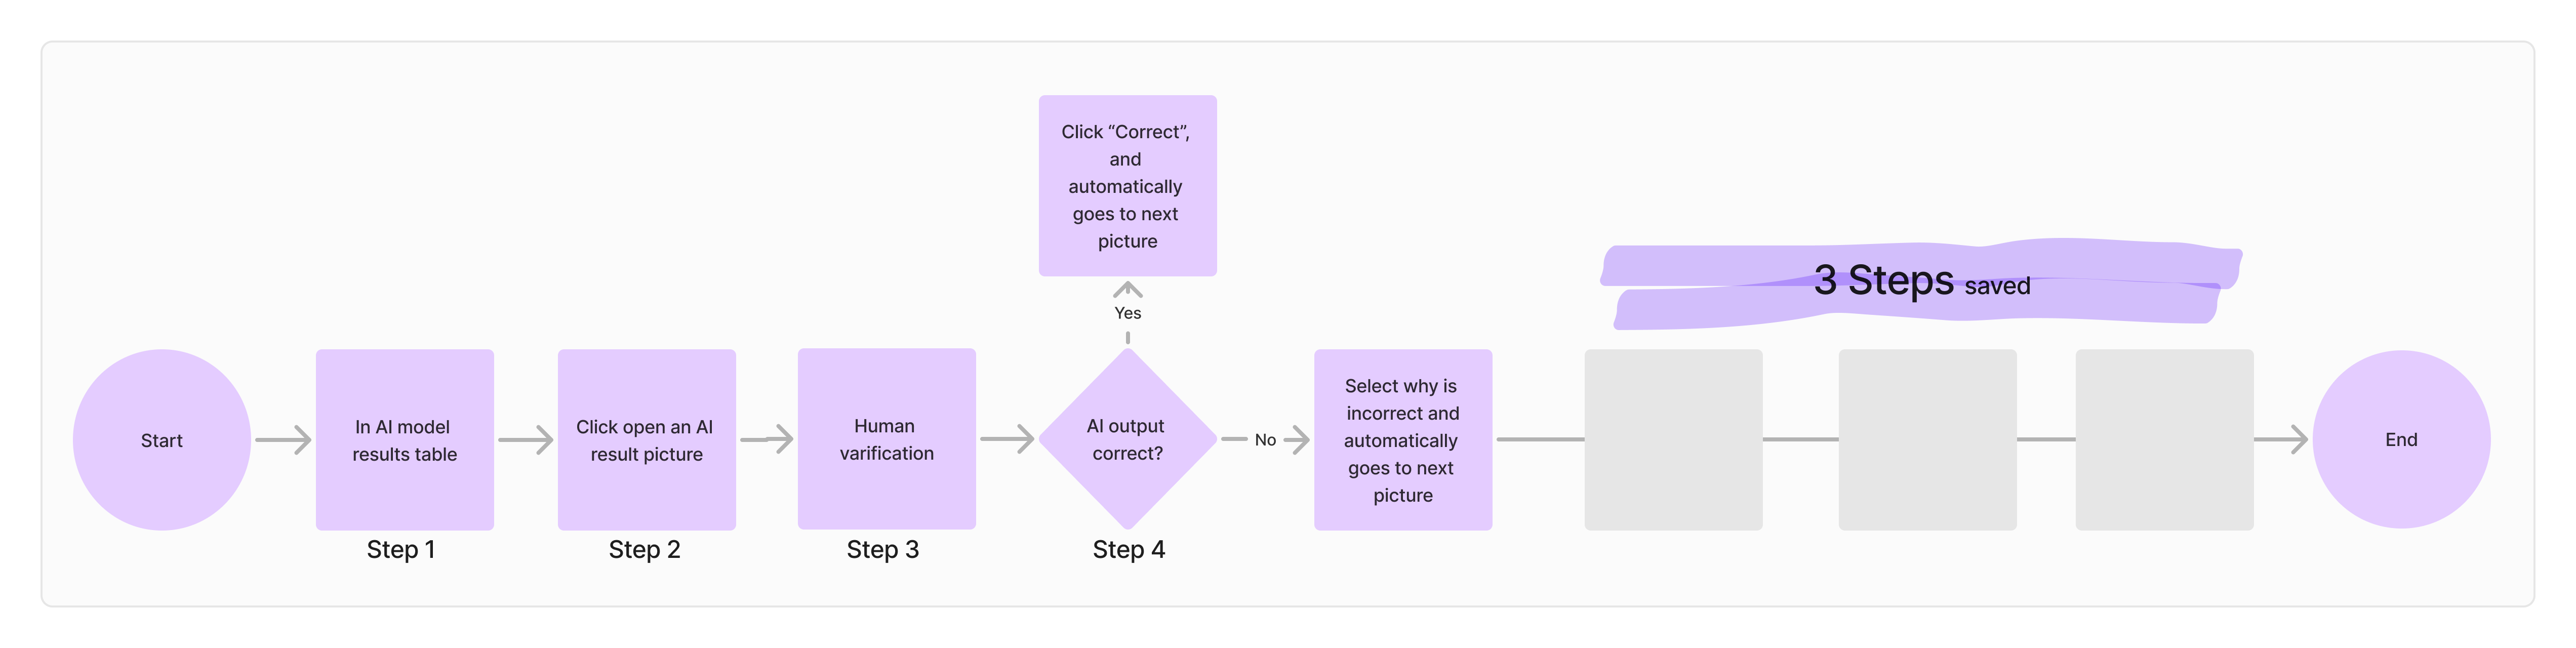
Picture 3: AI Output Verification Flow Optimized—Before and After
After consulting with users, I also redesigned the alert flow. Initially, alerts were directed to workers, expecting them to immediately adjust their behavior. However, this approach was disruptive, as all workers in the room had to stop their tasks and assess whether they had breached the rules.
To resolve this, we decided to redirect the alerts to someone like Talia, the Quality Control Technician(Picture 4). She can identify the worker in question, provide a targeted reminder, and maintain a record of non-compliant behavior for future reference. This approach reduces disruption and allows for more effective monitoring and correction.
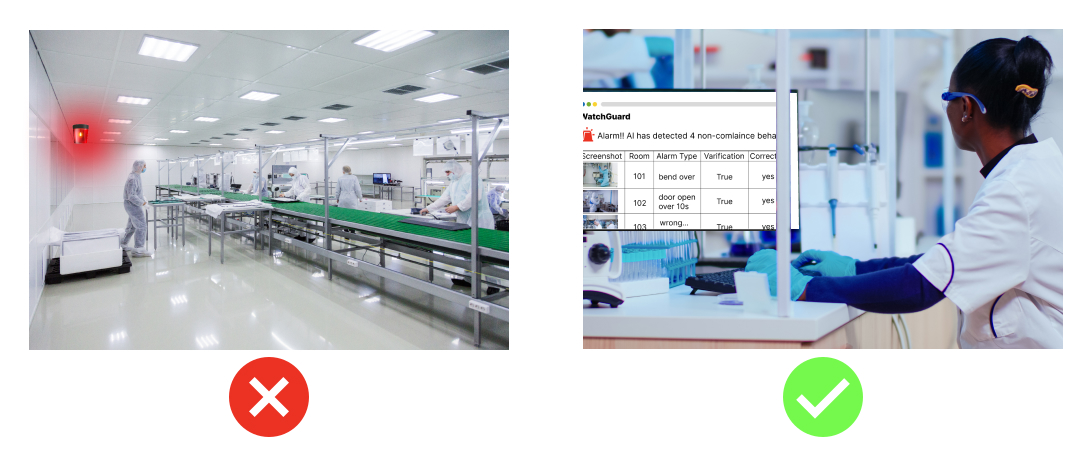
Picture 4: Redesigned The Alert Flow: From Alert All Workers To Alert Only The Quality Control Technician
Shifting Focus to Data While Enhancing the Model
While the key measure should focus on how many non-compliance behaviors are caught and prevented rather than solely on detection accuracy, improving our model's accuracy remains a top priority. False alarms from the AI model disrupt the workflow and require significant human effort to verify. Through a root cause analysis, I identified that the primary issue behind the low accuracy is poor data quality. After a thorough discussion with Alex, our AI engineer, we concluded that instead of concentrating solely on optimizing the AI model, our efforts must prioritize improving the quality and accuracy of the data.
Classify and Fix Incorrect Data Types
"Data tells the biggest truths and the biggest lies." WatchGuard was supposed to be a reliable tool based on real-time data streaming from cameras, but it ended up generating many false alerts. I took the overcrow model as an example and reviewed its false results. The overcrowding model is originally designed to trigger alerts when the number of people in a room exceeds the compliance limit. After a careful review of over 7,000 pictures evenly sampled from the live cameras over past three months, I identified seven main types of errors(Picture 5):
- Incorrect count something else as a person, like a trash can filled with white bags, as human in white lab awnings.
- Double counting on one person.
- Miscounting people reflected in a mirror.
- Incorrectly counting people reflected on glass or stainless steel surfaces.
- Miscounting people outside the room, visible through windows.
- Miscounting body parts as individual people.
- Failing to count people behind facilities, where only part of their body is visible in the camera.
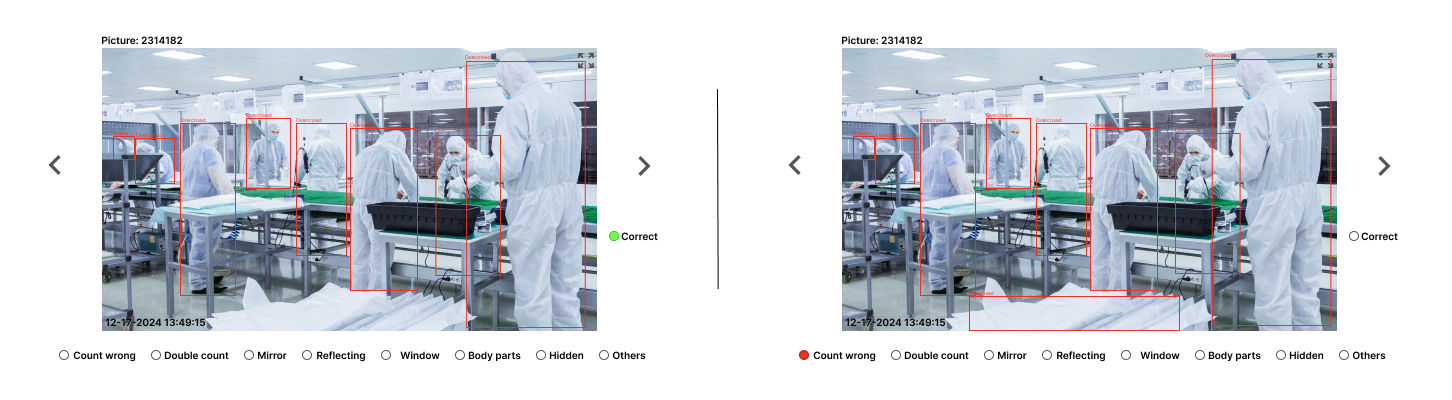
Picture 5: AI Output Human Varification Optimized Interface
Phase results: I shared these findings with Alex, the AI engineer, who focuses on improving the AI model configuration, and asked if we could address each of these issues specifically. The response was yes! But we need more of those datasets accordingly.
Enrich the datasets in variety
In the WatchGuard system, the AI model processes footage captured in seconds from live-streaming cameras located in the drug production rooms. Me and Alex, the AI engineer, examined the dataset used to train the model. We found that while the dataset is massive, it lacks sufficient diversity. For example, we have the gowning AI model, which ensures workers comply with hygiene standards by preventing contamination from human sources.
The gowning scenario was included in the project due to its high importance as humans can be a major source of microbial contamination in drug manufacturing. This scenario is also crucial for protecting workers by ensuring they don’t expose any skin to possible hurts from reagents or solutions. However, this is also one of the behaviors where workers tend to comply most consistently. As a result, we don’t have enough footage to train the model on issues like improper gowning type, miswearing masks, gloves, shoe covers, or head covers. To address this, I drafted a Gowning Data Gathering Manual for the drug department, requesting their assistance in capturing more varied footage, 600 wrong gowning pictures for each type after consulting with Alex.
Phase Results: Due to the tight production schedule, we couldn't find an open window to collect the necessary data. However, we were directed to use footage from the factory’s maintenance downtime, when maintenance staff were seen mis-gowning.
Communication Strategy: Building User Alignment
In the face of major disappointment with the project, users struggled to understand what went wrong. Many simplified the failure, concluding that the model's performance was poor. However, I recognized that the AI model works iteratively with data and requires ongoing training based on evolving datasets. One key issue was whether the current dataset covered all business scenarios. Clearly, the existing model, particularly for gowning (identifying if workers are properly dressed with masks, gloves, shoes, and proper coverage), was incomplete. To address this, we need at least 600 negative images for each scenario, but in reality, we only had a few. Additionally, if new business scenarios arise, these need to be added to the dataset, and the model retrained. Before any new training, it’s premature to conclude that the model's performance is low.
I identified that users needed to adopt an iterative mindset and understand their role as key contributors to the project. They must provide representative datasets and ensure continuous updates. To foster user collaboration toward a common goal, I spoke with Alex and suggested regular progress meetings with users, where we could showcase the successes of the model outputs.
Model Progress Meetings with Users
I helped Alex organize and outline these meetings, which were designed to transparently share the model's progress with users. The goal was to provide key information about the model, including the number of datasets, metrics of the model's accuracy, the model's sensitivity, and the model's performance(Table 1). By doing this, we empowered users with a deeper understanding of the project’s status. This not only helped clarify the importance of a continuously evolving dataset but also encouraged active participation from the users. These meetings also highlighted the benefits of transparency and collaboration, ensuring that users see the direct impact of their contributions.
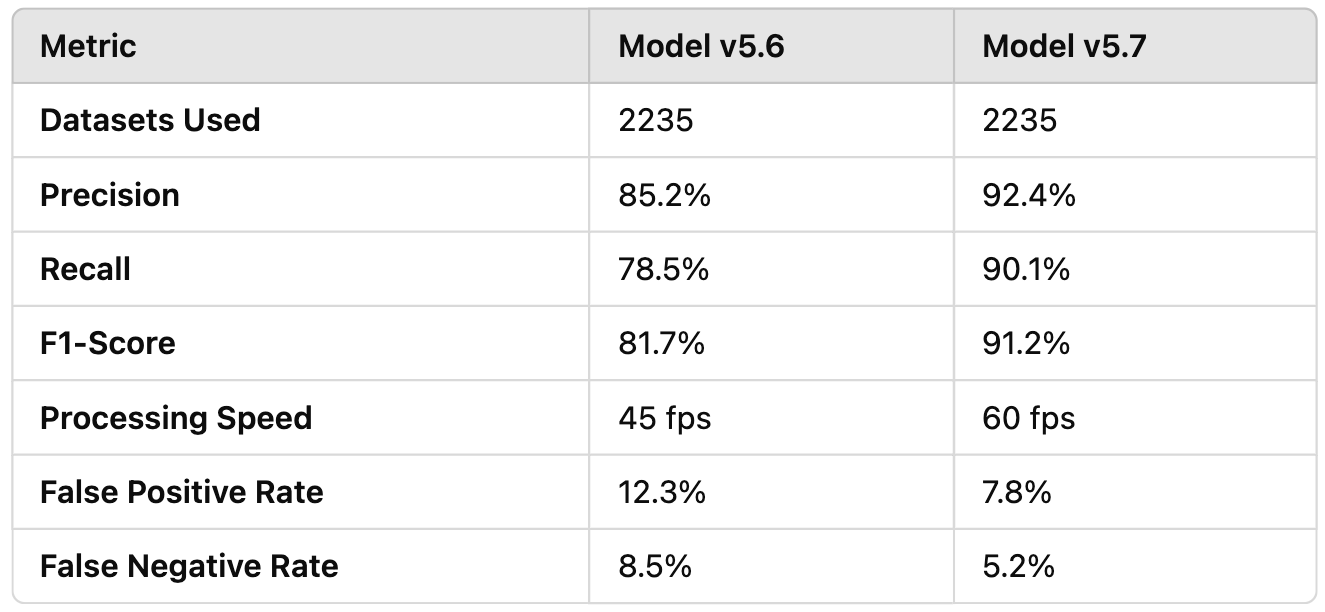
Table 1: Overcrowd Model Performance Comparison
Regaining Trust Through Gradual Model Outcome Email Reports
In addition to providing hard data on the model’s performance, I introduced visually engaging graphic email reports(Chart 1) to make the results more accessible and impactful. These reports combined detailed statistics with clear, attractive visualizations, vividly illustrating the model’s trajectory. They highlighted how much non-compliance behaviors were detected in each production room and the accuracy of those detections. Over four months, the model identified hundreds of behaviors with only three errors, offering a clear demonstration of its effectiveness. This approach not only gave users transparent insights into the model's progress but also helped rebuild their trust. The benefits of this initiative included fostering confidence in the model’s capabilities, reinforcing the project’s positive momentum, and showcasing the tangible impact of their involvement.
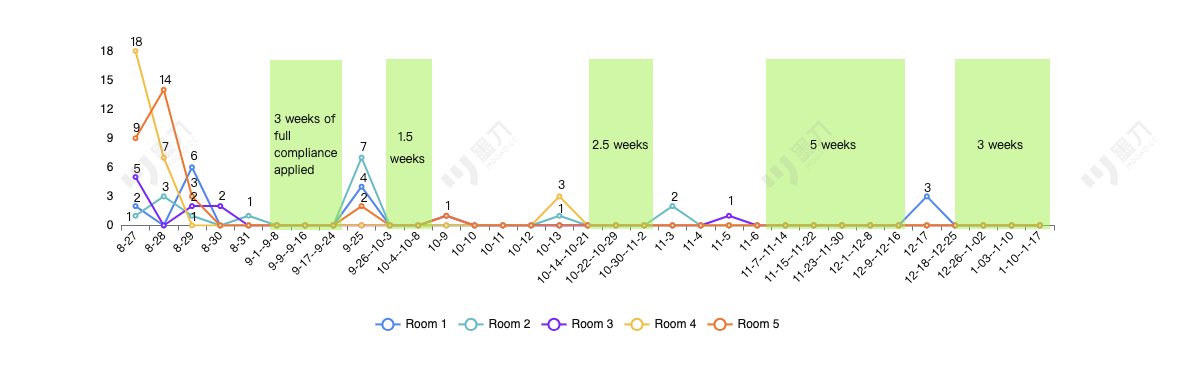
Chart 1: Overcrowd model v5.7 Correct Output Distribution in 4.5 months
Driving Technology Innovation: Optimizing Model Selection and Dataset Preparation
To improve the accuracy of AI model detections, I recommended that the team focus on creating a more representative dataset and iterating continuously, which led to significant success with the over-crowding model. Simultaneously, my team and I prioritized evaluating the performance of various computer vision models to determine the most suitable one for our specific use case.
I spearheaded a comparative analysis of various models, including human label image via LabelImg and object detection (YOLOv7) vs instance segmentation (Mask R-CNN) and positive/negative classification (Inception V3 via MATLAB). As the key point of contact, I conducted an ad hoc review of several thousand data points to inform our decision-making. Through this process:
- Instance Segmentation (Mask R-CNN): This model performed well on its own, effectively segmenting human figures and reducing the human labor needed for dataset labeling compared to LabelImg. However, it struggled with dynamic, real-time footage, often producing a variety of human shapes and body parts, which led to confusion in Inception V3’s classification of what was considered "negative" and "positive".
- Positive/Negative Classification (Inception V3): Due to the high variability in WatchGuard user scenarios, this approach faced challenges in handling the complexity and dynamic nature of live-streamed behaviors in drug production rooms, making it less suitable for our needs.
- Object Detection (YOLOv7): YOLOv7 excelled in handling diverse and complex behaviors, especially in dynamic environments with intricate backgrounds in drug production rooms. This made it the most versatile and robust choice for our project.
Benefits of the Ad Hoc Analysis:
- Informed Decision-Making: Testing models against real-world data helped us identify YOLOv7 as the optimal choice, ensuring the solution aligned with practical needs.
- Resource Optimization: The analysis revealed trade-offs between automation (instance segmentation) and accuracy in dynamic environments, enabling us to allocate resources efficiently.
- Improved Outcomes: YOLOv7’s ability to handle complex behaviors led to more accurate AI detections, boosting user trust and enhancing compliance monitoring.
This innovative approach not only addressed technical challenges but also highlighted my ability to align technological decisions with business goals effectively.
Achievements of the WatchGuard Project
Through the implementation of the Revitalize WatchGuard Strategies, significant progress has been made in reshaping the project and achieving impactful outcomes:
- Optimized WatchGuard Website: The website has been streamlined for better usability, enabling easier navigation and efficient verification of AI-generated alerts.
- Successful Overcrowd Model Deployment: The optimized overcrowd model has completed a three-month online test with an impressive 98% accuracy rate, demonstrating its reliability in live production environments.
- Progress on Additional Models: Other models targeting specific non-compliance behaviors—such as gowning without gloves, door open, and bend over—are currently in the User Acceptance Testing (UAT) phase. These models await further testing with real-time footage captured from production room cameras.
Next Steps of the WatchGuard Project
To build on these achievements, the following actions will be prioritized:
- Deploy Additional Models: Finalize testing and proceed with the deployment of the door open, gowning-no-gloves, and bend over models in live environments.
- Monitor Model Performance: Continuously track the accuracy of deployed models to ensure robustness, especially as new data is introduced during live operations.
- Scale the Solution: Expand the system to cover additional rooms and facilities, increasing its reach and overall impact across production sites.
- Effective Collaboration Between Teams: Collaboration with cross-functional teams, particularly with Alex, the AI Engineer, was crucial to identifying and resolving issues. By working closely with him, I helped make critical decisions regarding model selection and dataset preparation. The ability to communicate effectively between product, AI, and operational teams ensured the project stayed aligned with business goals.
- Develop an Compliance Accumulation Chart for Targeted Interventions: To best amplify WatchGuard's business impact, an Compliance Accumulation Chart Report(Chart 2) will be developed. This report will provide a clear overview of which drug production rooms consistently perform well and which struggle with compliance over time. By leveraging these insights, targeted training sessions and heightened compliance interventions can be implemented to address recurring issues, ensuring a more effective and focused approach to improving overall compliance across facilities.

Chart 2: WatchGuard Compliance Accumulation Trends Chart
Takeaways from the WatchGuard Project
- Building Trust Through Transparency: A critical lesson from this project was the importance of rebuilding user trust after prior setbacks. By providing regular, transparent updates on the model's progress through graphic email reports and model outcome meetings, we demonstrated tangible results, ultimately fostering confidence in the AI’s effectiveness. This reinforced the value of transparency in keeping users engaged and motivated, despite past disappointments.
- Iterative Approach to Improvement: One key insight was the power of an iterative mindset. Shifting the project’s focus from "How accurate is the model?" to "How many behaviors are detected and prevented?" helped align the project with its core objective—improving compliance and product quality. Encouraging users to adopt a continuous improvement mindset, including providing updated datasets, became a vital component of the project’s long-term success.
- Data Quality Over Model Perfection: The analysis revealed that improving the dataset quality had a more significant impact on the model’s performance than merely optimizing the AI model itself. By addressing data issues such as miscounts and poor dataset diversity, we were able to reduce false alarms and increase detection accuracy. This reinforced the idea that data is foundational to AI effectiveness and needs constant attention.
- Effective Collaboration Between Teams: Collaboration with cross-functional teams, particularly with Alex, the AI Engineer, was crucial to identifying and resolving issues. By working closely with him, I helped make critical decisions regarding model selection and dataset preparation. The ability to communicate effectively between product, AI, and operational teams ensured the project stayed aligned with business goals.
- Adaptation to Real-World Challenges: A major takeaway was the ability to adapt to the real-world complexity of the drug production environment. The need for a model that could handle diverse and dynamic scenarios, such as those found in drug production rooms, taught me the importance of flexibility in model selection. YOLOv7’s success in this environment demonstrated the importance of evaluating multiple models to find the best fit for specific challenges.
- User-Centered Product Design: Redesigning the user flow and introducing feedback mechanisms helped improve the model’s usability and its integration into daily workflows. By aligning the design with the users’ needs—especially Talia, the Quality Control Technician—we reduced inefficiencies and made it easier for users to verify and interact with the system.
- Strategic Focus for Success: The use of the lighthouse strategy, where we focused on a smaller group of users (Plant A) first before scaling, allowed us to achieve early wins. This helped reinvigorate the project, generating positive momentum that could be shared with the wider user base.
This project demonstrated how product strategy, continuous iteration, and cross-functional collaboration can turn around a struggling initiative, aligning technology with business goals while fostering user trust and engagement.
Read More Of My
Case Studies
Role: Product Manager Responsibility: Product Strategy, Product Design, Project Management Client: Regulatory Affairs, Project Managers, and Functional Leaders in a pharmacy CRDMO company Was on Project: April 2022 - Februry 2023 Special Note: Due to a Non-Disclosure Agreement, "Reportauto" is a placeholder name. The names of people and product images on this site have been specially recreated solely for the purpose of showcasing my work.They do not represent the actual project.
Project Overview
Reportauto is a tool designed to automate report generation for a CRDMO (Contract Research, Development, and Manufacturing Organization). As a contract organization, the company must continuously update and deliver reports to clients upon request.
Reportauto aims to streamline report generation by enabling one-click automation. The system allows users to create report templates in advance, which can then be automatically populated with data from internal systems. For reports like IND (Investigational New Drug) reports and technical reports for clients, users can simply click a button to generate a fully populated document, with data seamlessly pulled from the unified database (Picture 1). This approach eliminates manual data entry, enhances efficiency, and ensures accuracy in report creation.
However, like the WatchGuard project, Reportauto had faced years of challenges in achieving effective functionality. I joined the project in April 2022 to make this vision a reality by addressing technical and organizational challenges.
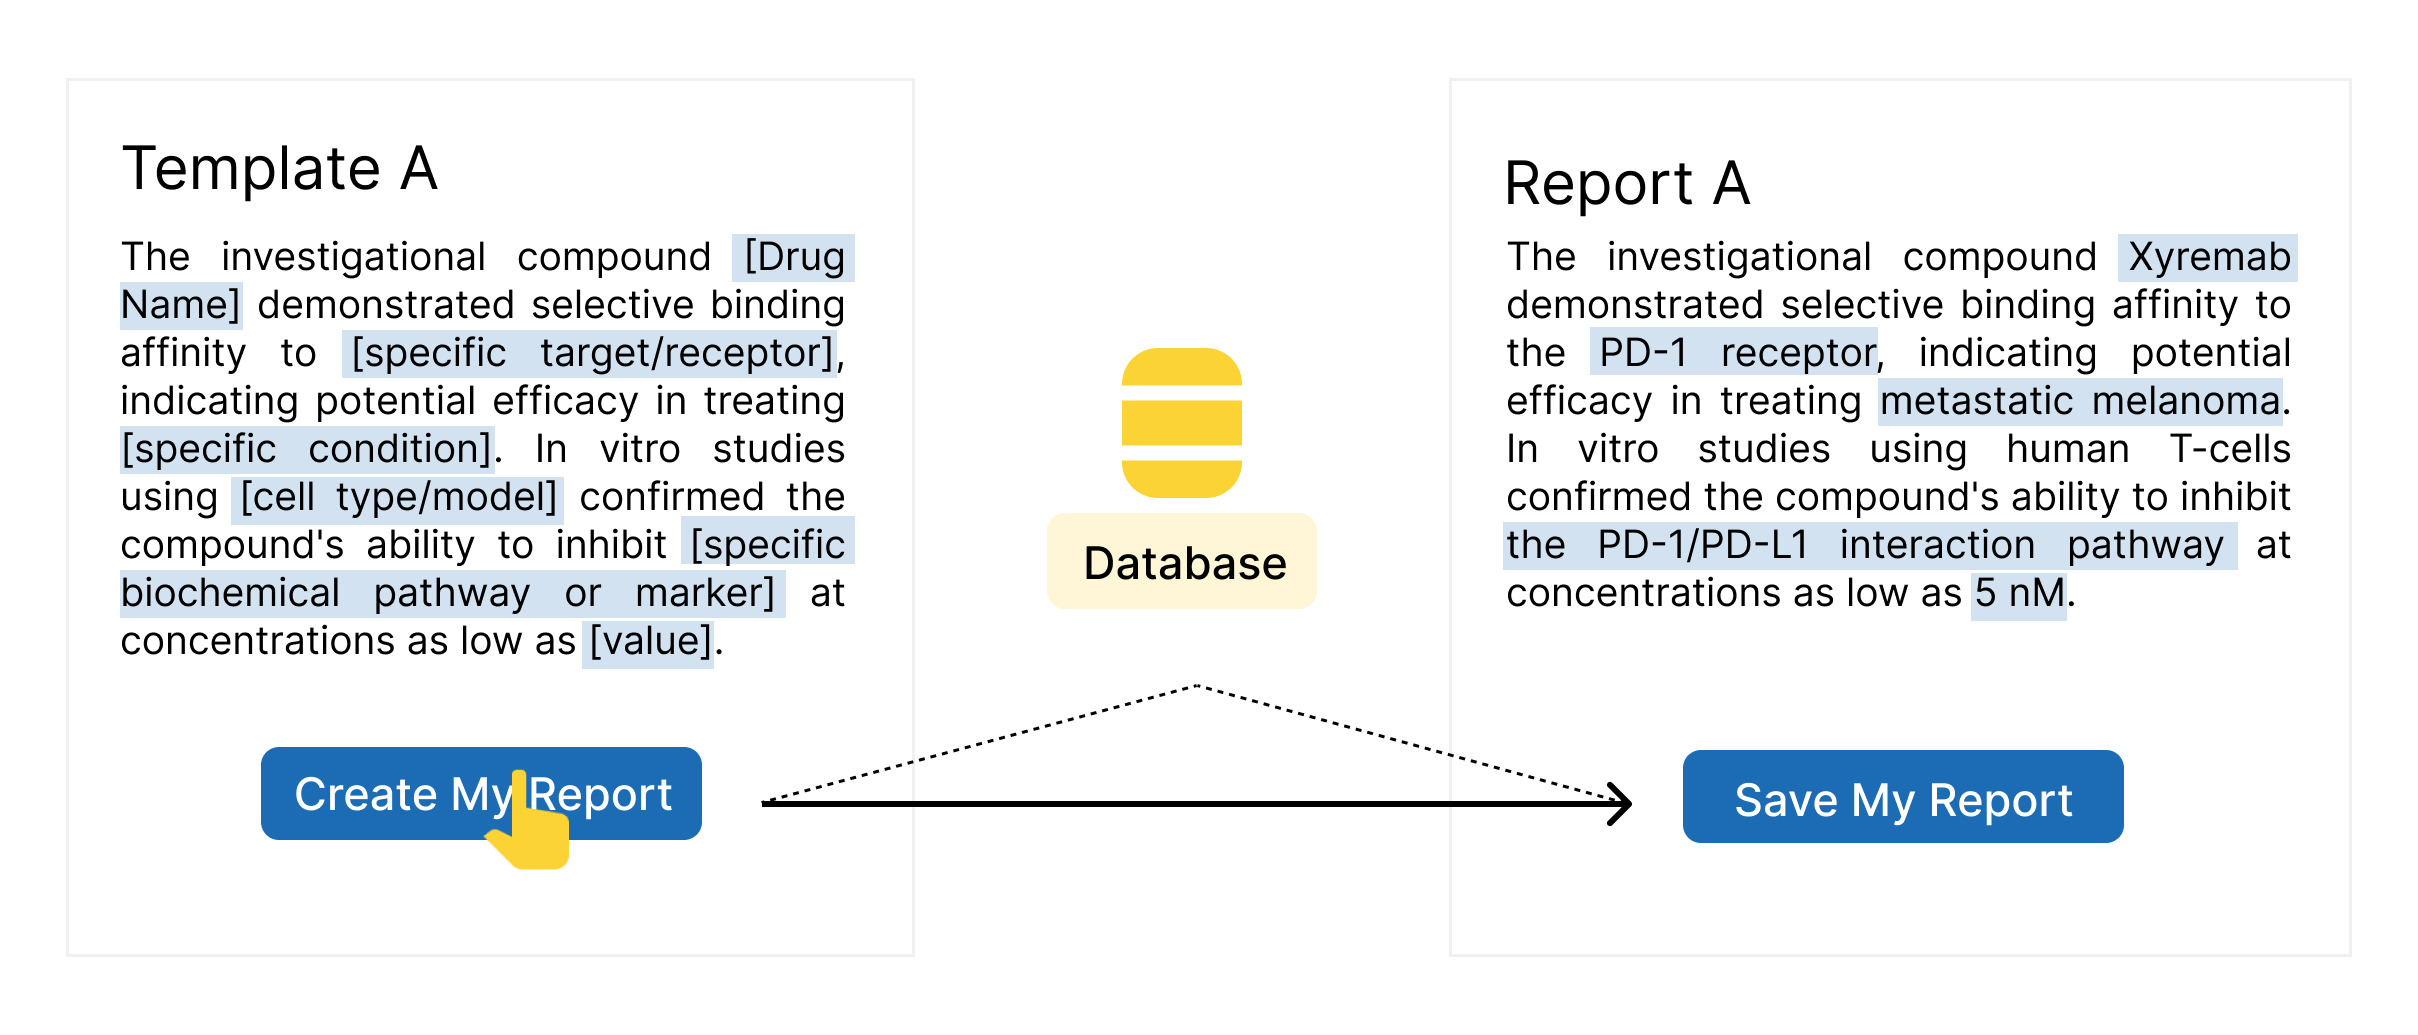
Picture 1: clicking "Create My Report" instantly populates the template with database data from the back-end system, generating a report in seconds.
The problem
- Limited Website Functionality
- The first-phase website allowed only partial auto-population of fields using a hard-coded database, falling short of the automation goal.
- Redundant features cluttered the user interface, while some essential ones were missing or poorly designed.
- Fragmented Data Systems
- The company-level database was still under construction, with data scattered across departmental systems like LDMS(Laboratory Data Management System) and LIMS(Laboratory Information Management System).
- Inconsistent schemas, formats, and units across databases complicated data integration.
- Inefficient Collaboration Processes
- Critical user workflows for internal and external review cycles were not integrated into the system, leading to offline, error-prone operations.
- Teams relied on email attachments and manual edits, making report finalization cumbersome.
- Cumbersome Template Creation
- Report templates were created using manually labeled, poorly named variables (e.g., DS-1238), which hindered scalability and data mapping.
The goal
To transform Reportauto into a robust system capable of fully automatic report generation by:
- Streamlining Data Integration: Harmonizing data collection from departmental systems and ensuring schema consistency.
- Integrating the Website with a Unified Database: Establishing connections to a standardized company-level database.
- Supporting Collaborative Workflows: Incorporating processes for internal and external reviews, feedback, and editing into the system design.
- Optimizing Template Creation: Standardizing and automating variable labeling to simplify and accelerate the creation of new report templates.
Understanding the user
At this phase of the project, the focus is on generating IND reports and Technical reports, as these are the most requested by clients. Through extensive communication with stakeholders, three key user groups were identified, each with distinct challenges and needs:
Persona and Problem Statements

Functional Leader (FL)
Ben works in the Cell Line Development (CLD) department and is responsible for writing reports for his projects. Problem Statement:
Ben faces significant challenges in accessing data for his reports. These data are scattered across different systems, such as machine-generated data from HPLC Chromatography Systems, online databases like LDMS, and offline paper records. Retrieving these information is time-consuming and prone to delays, which hinders his productivity.

Functional Area (FA)
Amina is also part of the CLD department and is tasked with reviewing reports generated by team members like Ben. Her role involves ensuring that reports are accurate and meet standards for good scientific writing. Problem Statement:
Like Ben, Amina also spends a considerable amount of time cross-referencing data logs from various sources to validate report content. This repetitive review process feels redundant since Ben has already accessed the same data, making her workflow inefficient and time-consuming.

Project Manager (PM)
Santiago, a Project Manager, oversees the entire drug production process and updates clients through technical reports. These reports often provide content for the later IND reports. Problem Statement:
Santiago’s primary challenge is ensuring high client satisfaction. While accuracy is essential, clients frequently provide feedback on the grammar, wording, and overall quality of scientific writing in technical reports. Santiago is keen to improve these aspects to better meet client expectations and strengthen the company’s reputation.

Regulatory Affairs (RA)
Sofía, a Regulatory Affairs professional, is responsible for compiling and delivering IND reports to the company’s clients. Her workflow includes distributing report sections to different departments via Microsoft Word email attachments, supervising progress through weekly meetings and daily follow-ups, and consolidating content for final review before submission. This process often involves multiple rounds of feedback and revisions. Problem Statement:
Sofía struggles with the lack of integration and communication between departments. Although parts of the IND report overlap with technical reports, limited coordination with Santiago and his team—due to departmental silos—makes it difficult to reuse content effectively. Additionally, within the same department, simultaneous work on reports complicates content sharing. For example, while Ben is writing a technical report in the CLD department, his colleague Meimei might already be drafting the IND report for the same project. This lack of synchronization results in redundant efforts and missed opportunities to streamline workflows.
More than that, Lilia’s offline workflow is inefficient and error-prone. Consolidating input from different departments—each using separate Microsoft Word files—is cumbersome and time-consuming. Excessive revisions harm client satisfaction and leave a negative impression. She seeks an advanced, collaborative solution to streamline the process, improve report accuracy, and minimize revisions.
Transforming Reportauto into a Fully Automated Solution
These challenges highlight a common thread across roles: the inefficiencies caused by fragmented data systems, manual processes, and redundant workflows. Ben, Amina, Santiago, and Sofía all struggle with retrieving, validating, and consolidating information scattered across disparate systems, often duplicating efforts in their respective tasks. Their pain points emphasize the urgent need for a centralized, automated, and collaborative solution that streamlines the report-generation process while ensuring data accuracy and report quality. This is where the update of Reportauto steps in, transforming it from a struggling project into a successful, efficient system that addresses these critical challenges.
Workflow Breakdown
- Report Template Creation
- Process:
- Templates are created in the backend as part of the Reportauto system development.
- Staff label variables in the templates, ensuring they are uniquely identifiable for automated data mapping and scalability.
- Variables are named using a readable and distinguishable format to facilitate future AI-driven enhancements (Picture 2).
- Challenges Resolved:
- Inconsistent and hard-to-decipher variable names like DS-1238 or BG-763 were replaced with meaningful names (e.g., Cytochrome-Type-E-IND-ADC-3.1.2.3-1).
-
To standardize the naming process, a Variable Labeling Manual was created, outlining guidelines for specific report types, such as:
- IND reports (English and Chinese)
- Drug-specific reports (e.g., monoclonal antibody, bispecific antibody, ADC drugs)
- Technical reports for various pharmaceutical processes.
- Human Review and Verification
- Process:
- Templates undergo human review by subject matter experts (SMEs) to ensure accuracy and alignment with report-writing standards.
- This step is also handled in the backend.
- Frontend Report Generation
- Process:
- Users search for a report template by name on the frontend and generate a complete report by clicking a button.
- The generated report can then be:
- Edited to meet specific needs.
- Shared with peers for feedback or submitted to supervisors (e.g., Functional Area or Regulatory Affairs levels) for review and approval.
- Submitted directly to clients and get feedback.
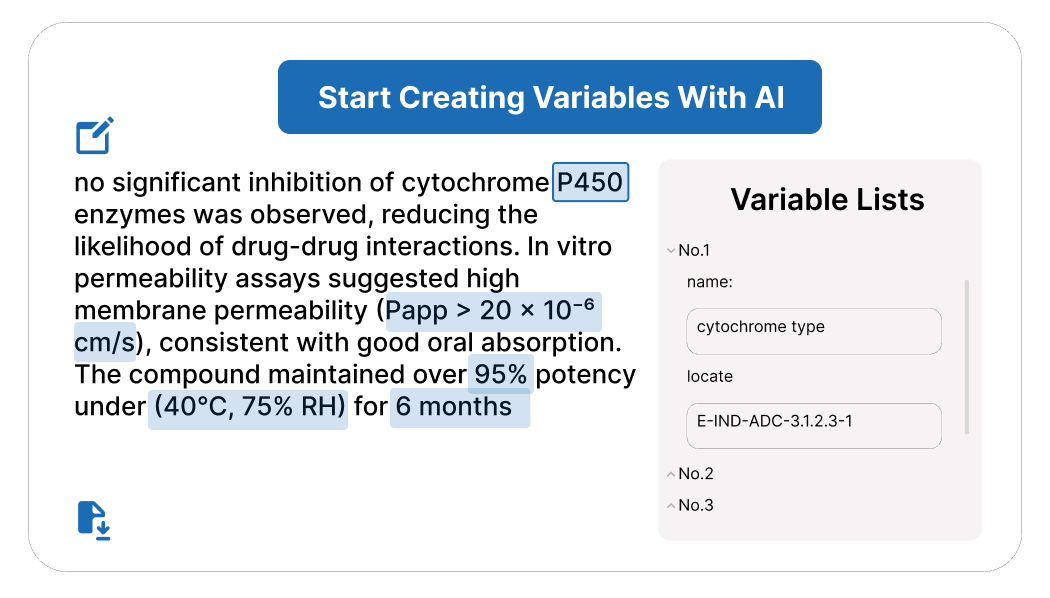
Picture 2: Reportauto Creating Variables With AI Entity Naming Technology
Data Centralization and Integration
Centralized Company Database
- Current State:
- unified company-level database is critical for Reportauto to function as intended. However, the database is still under development, with existing data scattered across departmental systems like LDMS and LIMS.
- Action Taken:
- Highlighted the database dependency to stakeholders to ensure a shared understanding of the project’s status and challenges.
-
Secured agreement to prioritize database development, leading to:
- Recruitment of a senior data engineer.
- Reassignment of a junior ETL resource from Reportauto to the database project.
Automated Data Mapping and Querying
- Dynamic Data Querying
- Process:
- Variables with readable names are mapped to specific data fields in the unified database using automated queries (Picture 3).
-
Steps include:
- Project Selection: User selects the project code (e.g., wbs-2438).
- Variable Identification: The system identifies relevant variables (e.g., Cytochrome-Type)
- Database Query: It retrieves data values associated with the variables.
- Data Retrieval: Values are fetched and formatted for report integration.
- Key Improvement:
-
Replaced the manual, hard-coded data path system with a scalable and dynamic query-based approach, significantly reducing ETL resource requirements and enabling adaptability for new variables and projects.
To standardize the naming process, a Variable Labeling Manual was created, outlining guidelines for specific report types, such as:
- IND reports (English and Chinese)
- Drug-specific reports (e.g., monoclonal antibody, bispecific antibody, ADC drugs)
- Technical reports for various pharmaceutical processes.
- Benefits of the Solution
- Efficiency: Eliminates redundant ETL processes and streamlines variable-to-data mapping.
- Scalability: Supports dynamic extension to new variables and reports.
- Data Accuracy: Ensures consistent data retrieval across projects.
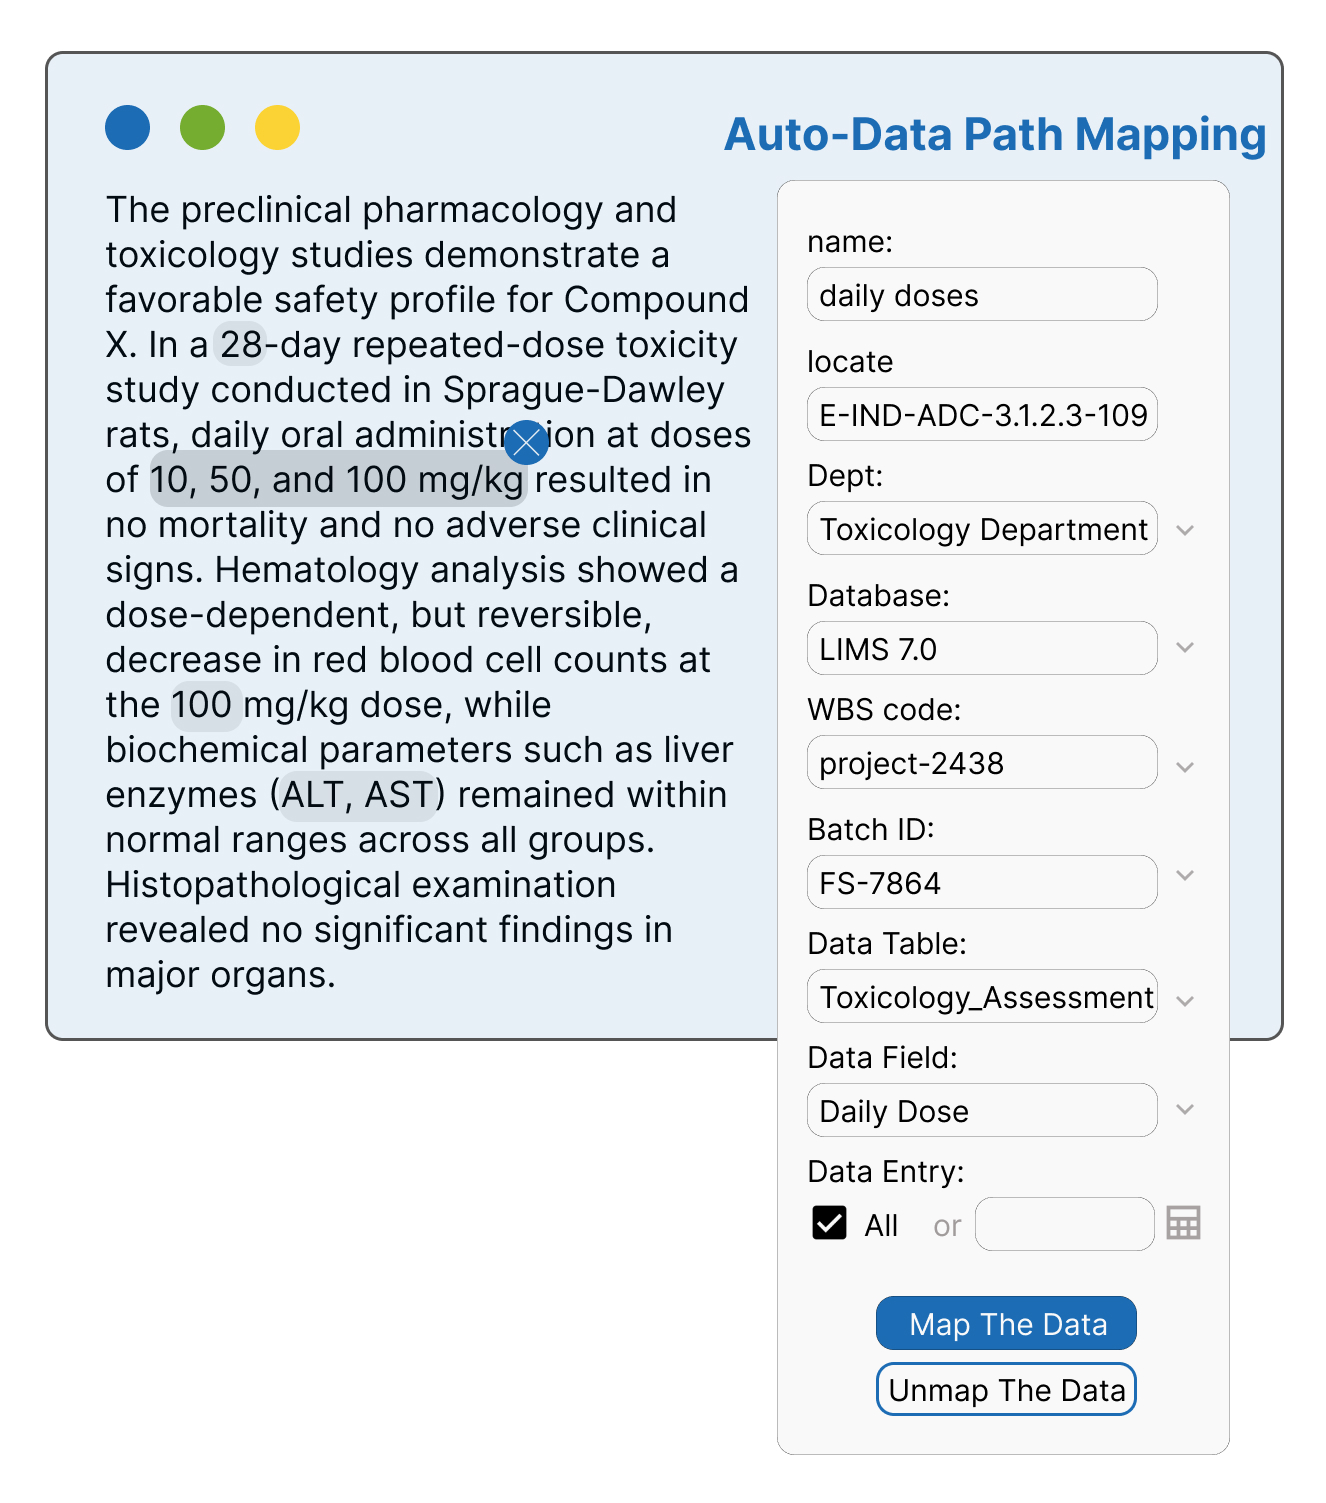
Picture 3: Reportauto Automatically Map the Data Path
AI-Driven Template Generation
Leveraging Labeled Templates
- Approach:
- Readable variable names and labeled templates from this phase are used as training data for AI entity naming technologies.
- AI assists in automating the labeling process for variables in new templates, significantly reducing manual effort.
- Benefits:
- Accelerates template creation for new projects.
- Ensures consistency in variable naming and mapping.
- Enhances the scalability and adaptability of the Reportauto system.
Achievements of the Reportauto Project
Through focused efforts and strategic problem-solving, the Reportauto project achieved significant milestones, laying a strong foundation for scalability and streamlining what was once a complex and chaotic initiative:
- Enhanced Automation: Integrated data from LDMS and LIMS into workflows, significantly improving automation rates.
- Template Configuration: Directed an 11-member team to configure and test 100 report templates (70 IND and 30 technical), driving user adoption.
- Standardized Variables: Spearheaded the standardization of 4,000 variables, enabling AI-driven data mapping and scalability.
- Resource Alignment: Secured stakeholder buy-in to prioritize database development, reallocating data engineer specialist.
- Dynamic Data Integration: Replaced static ETL processes with automated data queries, making data integration smarter and more scalable.
- AI-Driven Enhancements: Laid the groundwork for AI-powered template generation and variable labeling, ensuring long-term sustainability.
- Customer Support Excellence: Delivered 24/7 product knowledge support, defining success criteria across 11 business units to enhance customer satisfaction.
These achievements streamlined the Reportauto project, transforming it from disorganized complexity into a well-prepared foundation for future scalability and efficiency.
Next Steps of the Reportauto Project
The updates implemented thus far have laid a strong foundation for scaling Reportauto to support more projects and generate additional report templates. The following steps will further advance the project and align it with the company’s mission for comprehensive report automation:
- Complete Database Development: Finalize the unified company-level database and ensure seamless integration with the report templates to generate fully automated, accurate reports.
- Test Current Report Automation: Validate the report auto-generation process for the current project. This will ensure reliability and identify any gaps or improvements needed before scaling further.
- Expand Template Usage: Scale the current set of successfully automated templates to other projects, ensuring adaptability and user adoption across different domains.
- Increase Template Coverage: SDevelop additional templates to cover a broader range of report types and further enhance the company’s automation capabilities.
- Integrate AI for Template Generation: Replaced static ETL processes with automated data queries, making data integration smarter and more scalable.
- AI-Driven Enhancements: Implement AI entity naming technology to automate the creation of new templates. This will leverage the readable and distinguishable variables labeled during this phase, enabling faster and more efficient template expansion.
By following these steps, Reportauto will not only fulfill its current objectives but also evolve into a scalable, AI-enhanced solution capable of automating a wide array of reports across the organization.
Read More Of My
Case Studies
👋 Thank you for stopping by!
Let’s stay connected – I’d love to hear from you.
gaoyufair
@
outlook.com


Designed and developed from scratch, this site is my digital playground for showcasing my work and ongoing learning. It’s where I experiment, grow, and bring my ideas to life, one step at a time.
Copyright © 2024 Yu Gao. All Rights Reserved.
Linkedin
Github
Behance